The first look at NovaSAR-1 for applications in Australia – an exciting time ahead for SAR users
Dr Dipak Paudyal
e-mail: dpaudyal@apacgeospatial.com
Chief Scientist & Managing Director
APAC Geospatial
Fellow SSSI
Adjunct Associate Prof, University of QLD
Linkedin: https://www.linkedin.com/in/dipak-paudyal-b56aa534/
Web: https://apacgeospatial.com/
(Originally published on 8 Sept 2021)
The CSIRO deserves commendation for the new National Facility for Earth observation research and applications by providing a 10% capacity share in the NovaSAR-1 mission. It is a fantastic resource available for Australian users for both research and eventually for future operational use. I am very confident that it will help build overall capacity and generate a user base that is fully familiar with the working and applications of Synthetic Aperture Radar (SAR) data over Australia and our immediate neighbourhoods!
What value does NovaSAR-1 add?
Synthetic Aperture Radar, or SAR, is rapidly becoming a go-to method for remote observation. The use of SAR is advantageous over other remote sensing methods, such as optical data, for several reasons. Some of the most cited benefits are SAR’s ability to see through cloud cover and smoke and its ability to image an area regardless of illumination conditions, allowing it to be used both day and night. In addition to these, SAR scenes may also cover very large areas – exceeding 200km. SAR Imagery is therefore extremely versatile and may be used across a wide variety of applications – anything from hazard monitoring and disaster response (such as fire and flood), oceanographic monitoring for oil spills or ship detection, agricultural monitoring, change detection, subsidence, and displacement mapping through to estimation of forest biomass/carbon. This blog is an effort to have a look at NovaSAR-1 data and discuss the opportunities it can provide to the Australian user base for their Remote Sensing applications
NovaSAR-1 operates at S band microwave frequency (3.2 GHZ) corresponding to a 9.4cm wavelength. From an applications point of view, S-band can penetrate further into the vegetation canopy compared to C-Band SAR from the freely available Sentinel-1 from ESA operating at 5.4 GHZ corresponding to a 5.54 cm wavelength. We can expect that Sentinel-1,2 and NovaSAR-1 acquired images complementing each other very well!
How does NovaSAR-1 compare to Sentinel-1?
Not having come across Spaceborne S-band SAR data before, I decided to look into what additional value NovaSAR-1 may provide to users compared to Sentinel-1, to provide a comparative visual assessment of both data sets. I downloaded NovaSAR-1 data from the CSIRO datahub and Sentinel-1 and 2 from GA datahub. Figure 1 is a subset of the images (approx. dimension 8 kms X 18 Kms) over Tuckerang, a rural locality in the Western Downs Region in Queensland, Australia. For reference, it is approximately 55km NW of the town of Dalby. The area is predominantly agricultural with most of the fields already harvested as seen in the Sentinel-2 optical Imagery over the same area. I wanted to ensure that the acquisition dates were close. The NovaSAR-1 image on the left was acquired on the 20th of June 2021 and the Sentinel-1 scene on the 15th of June 2021. The Sentinel-2 scene in the centre was acquired on 21st June 2021. We can expect minimal changes in the cover type during this time span.
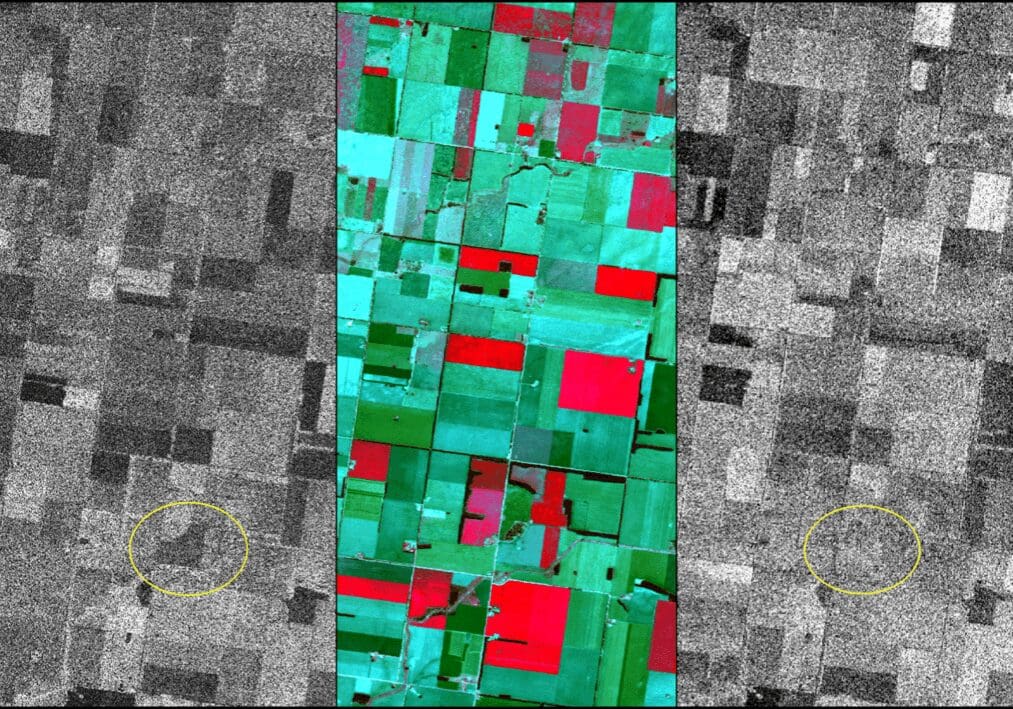
Figure: 1 (a) NovASAR-1 HH acquired 20 June (b) Sentinel-2 21 June (c) Sentinel-1 15 June
We can see from Figure 1 that NovaSAR-1 with slightly better spatial resolution (approx. 6 m) has a slightly better demarcation of field boundaries. Both SAR images are with HH polarisation and were downloaded as Single look Complex (SLC) products and geometrically and radiometrically corrected using ENVI SARscape a commercial SAR Processing software from sarmap SA/L3Harris Geospatial. It can be seen from the Figure that the way that C-band and S-band interact with the ground cover can be quite different for the identical cropping areas. An example is highlighted in the area drawn in yellow in Figure 1a and 1c.
How much Impact does speckle make in analysing NovaSAR-1 images?
We know that SAR images have salt and pepper type noise even in areas that are homogeneous. Figure 2a shows one such image over the same area (NW of Dalby). Speckles are inherent in SAR images and strictly speaking, are not a noise but a characteristic result of the SAR image formation process. The problem with the speckles is that they produce a very high variation (standard deviation) even in homogeneous areas resulting in less accurate results when subjected to traditional classification methods. SAR filtering is often commonly used to filter and smooth the imagery so that it looks homogeneous for both visual and digital analysis. The problem with filtering is that the smoothing may result in unpreserved edges (such as field boundaries) and/or significant alteration of pixel values. It is for this reason that various Speckle specific filters are designed to average out the homogeneous areas but preserve the edges/boundaries and image statistics so that information from the pixels are accurately retained for further analysis. One such speckle specific filter called the Gaussian Gamma MAP filter has been applied in the Single Look Complex (SLC) images using ENVI SARsc
ape. We can easily see that the filtered images in Figure 2b (right) are pleasing, analytically amenable to further digital analysis and make the image look like a single band of optical imagery!
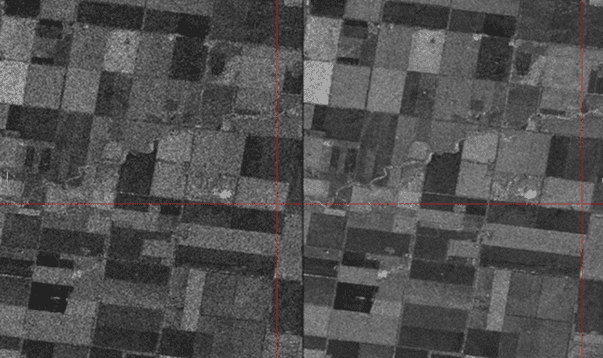
Figure: 2 (a) Unfiltered NovASAR-1 HH acquired 20 June (b) Speckle filtered NovASAR-1 HH
Detecting Changes: Multitemporal analysis
The single most important and most useful characteristic of SAR is guaranteed acquisition of images. Since SAR is an active system, it can operate day and night on a 24/7 basis and can acquire images relatively unhindered by rain, cloud, and other local adverse weather conditions.
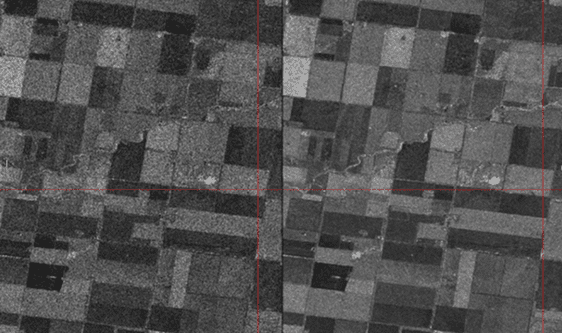
Figure 3 Multitemporal NovaSAR-1 HH SAR image captured over Tuckerang (NW of Town of Dalby), QLD from L to R (a) 5 Jan 2021 (b) 24 Feb 2021 (c) 15 April 2021 and (d) 20 June 2021
Detecting changes between two or more dates forms the crux of many agricultural applications. Figure 3 shows a series of SAR images captured over the same area between Jan 2021 to June 2021. These images display a clear variation on the fields over this time. Information from multitemporal NovaSAR-1 scenes can be analysed themselves or can be fused with other data, such as optical. This can be achieved through several time series-based workflows such as Intensity and Coherence. These dedicated workflows are available in ENVI SARscape and although I will not cover these topics within this blog, these methods of analysis of multitemporal SAR images do provide significant information for monitoring and mapping of agricultural areas over Australia.
Data Fusion: Combining SAR with Electro-Optical (EO) Images
Near real-time information obtained by SAR systems such as NovaSAR-1 can be combined with available electro-optical and other ancillary GIS and human intelligence data. These can be a wealth of extra information for some sectors of the economy, such as Agriculture. Monitoring of agricultural areas on a regular basis is one of the cornerstones of using Remote Sensing based technology– and NovaSAR-1 data provides that unique opportunity.
NovaSAR-1 imagery can be combined with EO (Electrical-Optical) imagery captured by Optical sensors such as Sentinel-2 and LiDAR point clouds if available. This makes it the best of both worlds – the world of SAR and Optical! It is often easier to show this with an illustration, which is one of my favourite ways of depicting the usefulness of such a data fusion technique. I have made use of an Additive colour triangle (Figure 4) to demonstrate this:
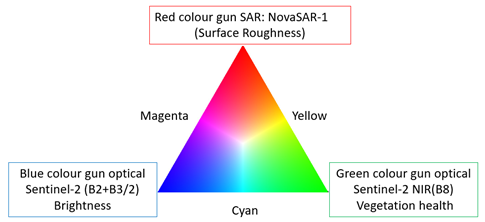
Figure 4: Additive colour triangle (in conjunction with Figure 5 below)
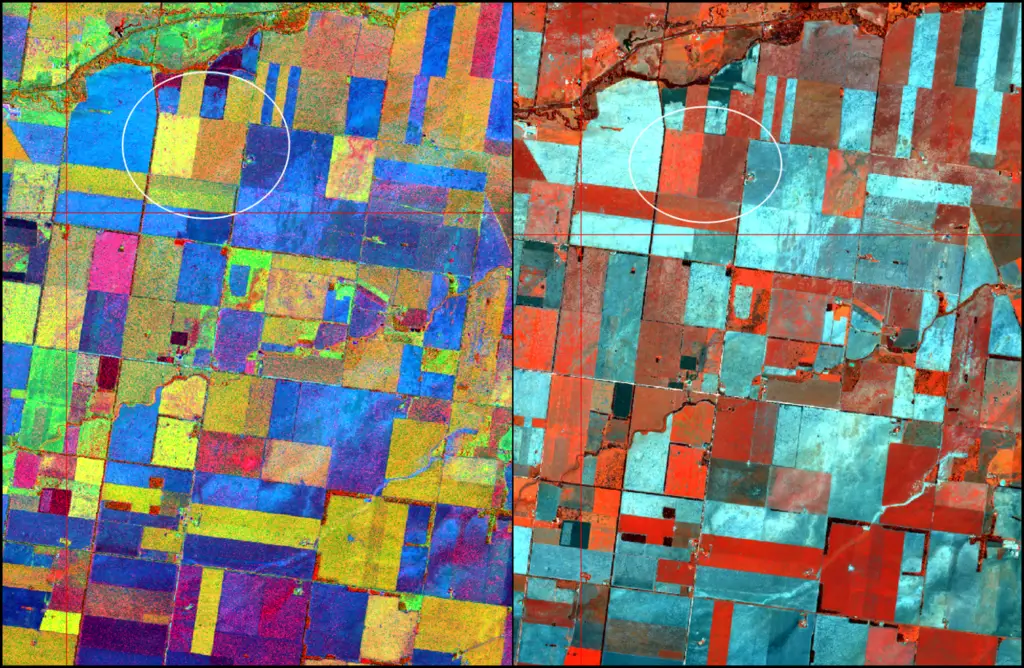
Fig 5 (left) is a colour composite based on the additive colour triangle using the NovSAR-1 image displayed in red colour gun. An average of the brightness bands (blue and green) are displayed in the blue colour gun and the Vegetation in Infrared is displayed in the Green colour band. The image on the right is a False colour Composite of Sentinel-2. The NovaSAR-1 Image was acquired on 20 June 2021 and Sentinel-2 scene a day after on June 21, 2021.
Figure 5 clearly demonstrates additional value obtained by inclusion of SAR, which adds another physical component in the analysis by bringing in Surface Roughness of the agricultural fields. The crops with higher surface roughness (relative to each other and NoVaSAR-1 wavelength) adds to the discrimination of crops which would not have been possible only with the Near Infrared band of Sentinel 2. In a similar vein, the bare agricultural areas (in range of cyan) show variations depending on if the farm contains any form of stubble, are tilled or have other physical differences.
To conclude, the monitoring and management of agricultural fields are vital for ensuring national and global food security. The imagery from NovaSAR-1 can support tasks such as crop identification, yield estimation, detection of areas affected by pests or disease, harvest date prediction and compliance monitoring.
Exploiting phase in NovaSAR-1 imagery:
A unique feature of SAR is that every “band†of the data potentially comes in two separate layers – intensity and phase. These are often complex data types and require pre-processing to morph into formats that are friendly to end users. This topic is important and will be the subject of a separate blog post in the future. I would like to further discuss the applications that require exploiting phase information, as well as the applications that require multitemporal monitoring and coherent change detection over an area to arrive at actionable information – so, stay tuned!
© SSTL 2021 (year of production) NovaSAR-1 Level 1 Data
The Data used to produce this research/product/service was generated by the NovaSAR-1 satellite owned and operated by Surrey Satellite Technology Limited and provided by CSIRO as the authorised licensor of the SSTL Data.
ENVI and ENVI SARscape was exclusively used to import, process, and analyse the Sentinel-1,2 and NovaSAR-1 SAR images used in this blog.
APAC Geospatial is the exclusive distributor of L3Harris Geospatial, in Australia including ENVI and ENVI SARscape. If you need a SAR image analysis software or solution for your Remote sensing applications, call 1300 348 668 or contact us here