Eye in the Sky: Mapping the Extent of Flooded areas in Southern QLD and Northern NSW using freely available Sentinel Imagery
Dr. Dipak Paudyal
e-mail: dpaudyal@apacgeospatial.com
Chief Scientist & Managing Director
APAC Geospatial
(Originally published on 22 Jan 2022)
The town of Goondiwindi, located in the Darling Downs region of QLD (and close to the NSW border), is currently surrounded by water due to a recent flood in the area. At the time of writing of this blog the flood waters continue to rise, causing significant loss of property and deep fears that some rural communities could cut-off for days if not weeks.
During natural disasters, such as this flood event, the ability to quickly gain a real-time view of the impact is highly crucial for fast, targeted response and recovery. The challenge for us as Earth observation professionals is to provide this information in an efficient and timely manner so that the affected communities are provided with meaningful, timely assistance as well as well targeted rescue and relief effort.
Remote sensing is inherently useful for managing natural hazards that are caused by geo-physical or climatic events, including earthquakes, volcanic eruptions, floods, droughts, storm events such as cyclones, as well as fires that threaten people’s livelihoods or property. Drones, aircrafts, and Satellites offer accurate, frequent, and almost near-real time data over large areas anywhere in the world.
When a disaster event occurs, remote sensing is often the only way to view what is happening on the ground. As Remote Sensing and Earth Observation professionals, it is our duty to provide software and services to assist in mitigation, preparedness as well as response and recovery effort to organisations and individuals directly and indirectly involved in disaster management.
How can we help?
The very first step in directing any relief effort is to identify areas that are affected. How quickly this can be done is based on our commitment to gather data and information over the impacted areas. As someone involved in Remote Sensing and Earth Observation, I would advocate for and immediately recommend anyone to simply to look to the skies above to get the crucial imagery needed to map the extent of the flood water. If we are good at planning, we can obtain images from Commercial Satellite data providers and these datasets can be put to use from day 1 of the flood event. Sometimes, things don’t go to plan, but thankfully we have publicly available satellite Imagery (thanks to the likes of ESA and USGS), which makes it possible for anyone to analyse and view areas affected by the flood. If we are lucky with the timing of satellite passing over the impacted area, then we may even get an estimate of the extent of the flood in almost near-real time. Following the devastating floods in the
Southern QLD and Northern NSW regions, I wanted to see firsthand the scale and extent of the damage caused.
We know flooding takes place due to heavy rainfall; and during heavy rain and cloud cover it is often difficult to get optical satellite imagery such as Landsat and Sentinel. Fortunately, Synthetic Aperture Radar (SAR) imagery comes to the rescue at these times. SAR imagery can be acquired day and night and even in times of cloud and rain. I quickly scrambled to find any publicly available SAR imagery over Goondiwindi area. Unsurprisingly, the Sentinel-1 Satellite had captured a SAR image over the area on December 4, around the time when the flood was at its peak.
In order to make a comparison between the time periods before and after the floods, a before image is also necessary. This is to isolate the flood affected areas using techniques of image change detection. Again, I found that there was also Sentinel-1 SAR imagery available over the exact same area in Goondiwindi acquired on 18th of November.
Now having the minimum of 2 required images, I started the process of identifying areas affected by the flood. I have summarised the steps I took to identify the Flood affected areas for those who may need reference material for workflows in future:
- I downloaded Sentinel-1 SAR imagery available over the flood affected area from Sentinel Australia Regional Access Hub.
- On downloading, I imported the Sentinel-1 SAR imagery using ENVI SARscape Software as a Single Look Complex (SLC) product. Importing the image as SLC provides me flexibility of creating downstream products to my own specifications rather than be constrained by what is provided by the supplier of the data (ESA in this instance) as a default product (grid). Below, Figures 1 and 2 show the pre-flood and post-flood Sentinel-1 Images imported using ENVI SARscape.
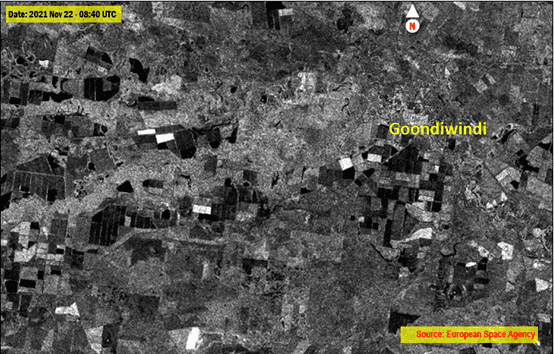
Fig 1: Pre-flood Sentinel-1 Image acquired on 22 Nov 2021
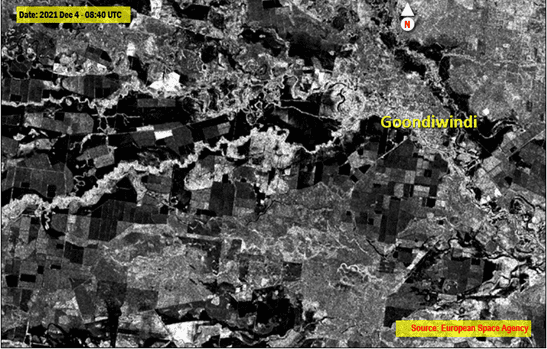
Fig 2: Sentinel-1 Image acquired on 4 Dec 2021 showing still flooding areas
- To provide some context to my analysis, I also downloaded freely available optical Sentinel-2 imagery also from the Sentinel Australia Regional Access Hub. I had a cloud free scene of Sentinel-2 Satellite Imagery acquired on December 3. I was fortunate to have a cloud free image so close to the flood event. Sentinel-2 imagery (Fig 3) shows the extent of flood. Fortunately, for those comparing between the images, the Sentinel-1 SAR imagery acquired on the following day shows the massive increase in flooded areas as floodwater swept through the area over the next 28 hours.
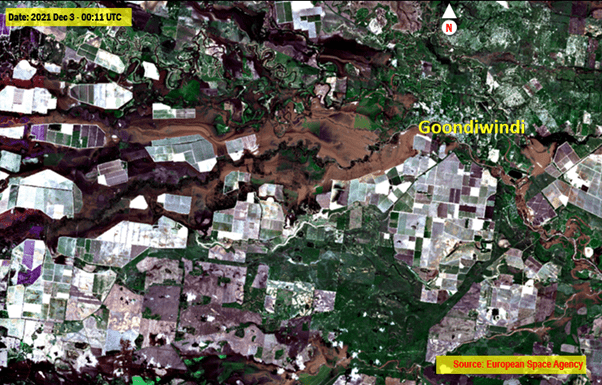
- Fig 3: Sentinel-2 Image acquired on 3 Dec 2021 showing still flooding areas
- Application of SAR specific filter – the beauty of using the SLC imagery is that application of the SAR specific filter can suppress any speckle (salt and pepper type noise) that is inherent in SAR images. I specifically applied a filter called Gamma Distribution-Entropy MAP (Gamma DE-MAP) available in ENVI SARscape to smooth both the pre-flood and post-flood images to ensure they were ready for change detection.
- Something to note is that the Sentinel-1 images shown above in Figures 1 and 2 were imported and filtered in satellite viewing geometry (i.e. not geometrically corrected), as operations such as SAR filtering are best done using Single Look Complex (SLC) images. Once the filtering was complete, the images were Geocoded to the Map Geometry again using the Geometric and Radiometric correction tool available in ENVI SARscape.
- Pre-flood and Post-flood change detection to isolate flooded areas was the next step after import, filtering and geocoding of the images to a common geometry. I used Image Change detection tool available in ENVI Â on the filtered before (image with no floods Nov 22, 2021) and after image during the floods (Dec 4, 2021). The results are shown in Fig 4 below, with the flooded areas shown in blue. I have overlaid the flooded areas over True Colour Sentinel-2 Imagery to make it easier to visualise the extent of the flooded area. As the flood is currently still occurring, the flooded area is likely to be even bigger if images were taken on December 5th or any other subsequent days.
- The flooded areas are also shown overlaid on a false colour band combination (Figure 5). In natural colour, vegetated areas are shown in green whereas in false colour composite, they are shown in red. We can clearly see vigorous vegetation growth in the area due to earlier rainfall as well.
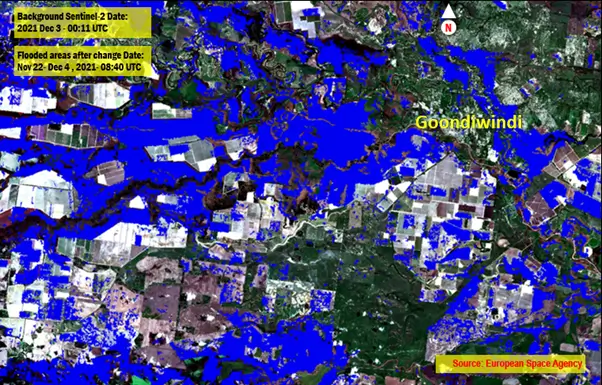
- Fig 4: Flooded area (in blue) extracted using method of Image based change detection overlaid on True colour Sentinel-2 imagery
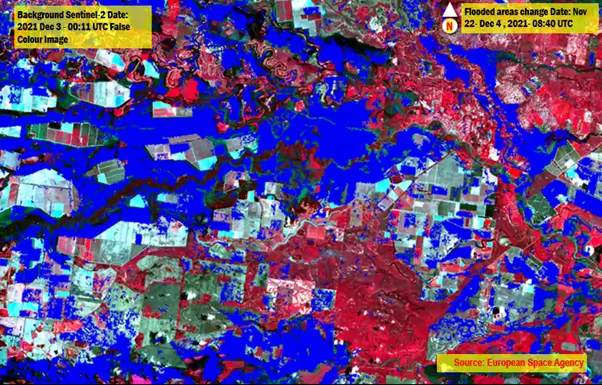
Fig 5: The flooded area (in blue) was extracted using method of Image based change detection overlaid on False colour Sentinel-2 imagery.
We can very clearly see the impact of the flood in the area and start to think how the information derived from this simple analysis could be useful to authorities in response and recovery efforts.
In reality, the recent flood has had effects on large areas including Inglewood, QLD amongst many other communities. It is likely the amount of water flowing through the rivers and channels is likely to cause major flooding in Northern NSW and other parts of Southern QLD.
The primary purpose of this article is to demonstrate the ease with which flooded areas can be extracted from publicly available imagery even through simple analysis of a few images. Identical analysis can also be extended to cover the entire areas covered by the flood. While first responders will be equipped with several other resources to get into action to combat the floods, the results provided above supply a very good macro view for authorities in head offices and senior Emergency Services officials for pre-flood and post-flood planning purposes.
Although the data used for this quick analysis is free, the same technology can be utilised to create more precise commercial-grade product, that provide much more detail. There is availability of several different SAR sensors, which have high revisit rates, including TerraSAR-X, COSMO-Skymed, Iceye and Capella space, to name a few. Further, more are planned to be launched in future which will further assist in the operational use of these techniques.
It is also possible to utilise Optical imagery from satellites such as Planet to complement the SAR based images. This is due to the fact that data from satellites such as Planet are available daily in most instances, and thus a matter of finding subsequent available cloud free imagery at the first opportunity during such flood events.
From a more practical and operational standpoint, flooded areas could be overlaid with property boundaries to show exactly which properties were impacted by the floods. To operationalise such a process would be relatively straightforward – it would require a timely acquisition of higher resolution SAR imagery, near real-time processing and dissemination of the information using image analysis using ENVI and ENVI SARscape, as well as dissemination of information to end users using GIS software tools such as Esri’s ArcGIS Online.
By combining Remote Sensing, publicly available free data (or commercial data if near-real time mapping is required) and GIS technology, stakeholders involved in disaster mitigation and recovery at every level (local, state or national) can create and share maps that drive accurate, timely responses.
*APAC Geospatial is Exclusive distributor of ENVI and ENVI SARscape products in Australia
To find out how APAC Geospatial could help you with your remote sensing software and solution requirements, contact us on 1300 348 668, via email on info@apacgeospatial.com or submit the form here.
Author details:
Dr. Dipak Paudyal
e-mail: dpaudyal@apacgeospatial.com
Chief Scientist & Managing Director
APAC Geospatial
Fellow SSSI
Adjunct Associate Prof, University of QLD
Linkedin: https://www.linkedin.com/in/dipak-paudyal-b56aa534/
Web: https://apacgeospatial.com/