Oh…..The Bunkers!! Removing the complexity of Deep Learning

18 February 2022
Dr. Dipak Paudyal
e-mail: dpaudyal@apacgeospatial.com
Chief Scientist & Managing Director
APAC Geospatial

The concept of deep learning has been around for many years, but only recently have many begun to explore its full potential for solving problems with geospatial imagery. When we consider how deep learning applies to images, we often think of object recognition, such as the ability to identify faces or vehicles from digital photographs. While that is still a popular use, there is a growing need to identify and categorise objects over a large geographic area.

From an operational perspective, what deep learning really does is help enable automation of a process that is traditionally done interactively, such as spectral based image classification.

An internet search for "deep learning in remote sensing" reveals some of the applications where it has been used to date—namely, image classification, vegetation mapping, and urban planning. So, what is deep learning and why is there so much hype around it? I tried to apply the techniques of Deep Learning to the game I love – a round or two of Social Golf!

As a remote sensing professional, when I am on the green, I would always think, how we could use imagery to monitor health of the golf course? I am sure I could do that, but I thought of something relatively easier - capture the golf bunkers (sand traps) automatically from imagery. Well, I thought this would be a good start to see how Deep Learning may really work is a real-world situation?

My first instinct suggested that it should not be too hard. Sand traps seem to be distinct in shapes, sizes, texture, materials, and their location in the golf course. If someone gave me an image over an area covering few golf courses, I thought it would be a piece of cake! I decided to give it a go.

My first question is, where do I start? One of the most important places to start is with what satellite imagery data is available for this area, and hopefully is for free! Something I knew from experience is that the imagery I need should have, at the minimum is 3-band Red, Green and Blue, and relatively good ground Sample Distance (GSD) of at least 50cm or so.  Fortunately for me, I found a 3-band (Red, Green, and Blue) satellite imagery called “Vivid Basic Imagery Base maps†that is made available by satellite imagery company called Maxar, as a sample which can be downloaded and used for evaluation purposes. The mosaic consisted of 220 separate tiles of WorldView-3 imagery. I was delighted that the mosaic covers the entire metropolitan area of Sydney, Australia, and approximate pixel size is 40 cm!  I

was now equipped to give it a go. The 3-band mosaic over Sydney is shown in Figure1.
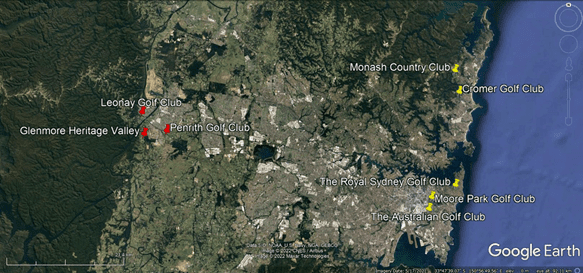
As I dug deeper into the imagery and zoomed into have a closer look at it, I found several golf courses. From a practical consideration, I had to choose a few golf courses that I would use to train my Deep Learning model. I would then preferably choose some more to test my model and validate that the model works. After some thought, I decided on 5 golf courses in Eastern Sydney to use for my training and 3 in Western Sydney to use for my testing. While I was choosing the golf courses, my real feature of interest was the bunkers (sand traps). I found a good way to show the locations using Google Earth (Figure 2).
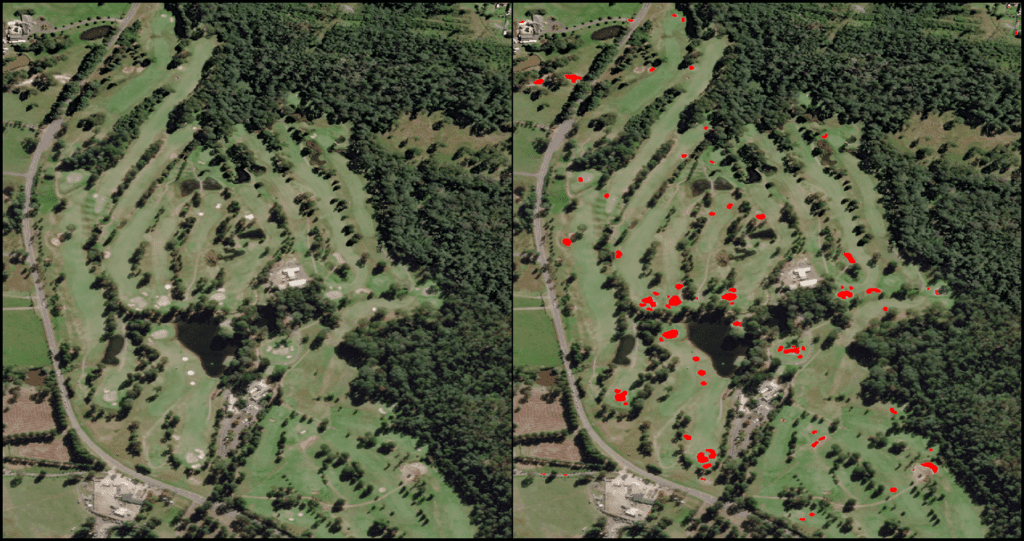
The first step in a deep learning methodology is to identify several examples of features from the imagery we would like to detect or capture – golf bunkers, in this case. These examples, or features, are then used to build what is called a Deep Learning model that learns from these features.

For this exercise, I decided to use ENVI® Deep Learning Module (more below) that is powered by TensorFlow, which is based on a convolutional neural network (CNN). A CNN uses a “deep†neural network to extract complex features from data in a hierarchical manner. It begins by learning spatial patterns (such as edges) at a low level, then extracts more complex features as the model progresses through deeper layers of data.

The model is called self-learning, because it keeps on recursively reiterating itself until it learns from the examples to produce an output which is of desired or acceptable accuracy. Once such a model is trained over a certain area with the given known examples, it can then be used to predict the outcome over the same area or totally different or new area. If the model is trained properly, then for our example, it should be able to identify the golf bunkers totally outside (Western Sydney) of the area where the examples were selected (Eastern Sydney).

My next step was to build, train, validate, and test how the model performs. I had to make a choice of which Deep Learning software to use. The software should ideally be easy to use and have a nice and clean interface, and with a very streamlined workflow – such as to make a complex task look very simple!  In this case, the clear solution was the ENVI Deep learning (DL) module by L3Harris Geospatial! ENVI DL provides TensorFlow-based CNN capability, either for Pixel Based classification (Semantic Segmentation) or using Object detection. For this exercise, I decided to use more traditional method of Deep Learning (Pixel classification).

The next challenge was to digitise my guiding examples, called labels. I scanned through the Vivid Basic Mosaic over Sydney and identified the following golf courses, mostly on the Eastern suburbs of Sydney show on in Figure 2.  Ideally, I should be selecting many labels that provide variety in shape, sizes, and colour. It may take little more extra time to capture these labels, but this is a time well spent, as by spending little more time in getting good labels I would build a robust DL model that would produce accurate and reliable result when applied over a totally different area.

Fortunately for me, the labelling tool provided as part of the ENVI Deep learning made my task a breeze. Digitising the polygons around the bunkers was so easy, quick, and accurate. Occasionally I used the ‘region growing†(or the seed tool) to speed the process up. In summary, what I thought could have been a painful exercise turned out to be much simple – thanks to neat labelling tool in ENVI DL!

Figure 3 shows Golf Bunkers in “The Australian Golf Club†captured as Labels (in red) to train the Deep learning Model. The Background image is Maxar’s Vivid Base Map at 40 cm spatial resolution. I created labels in similar fashion to Figure 3 for the rest of the four golf courses (Figure 4).
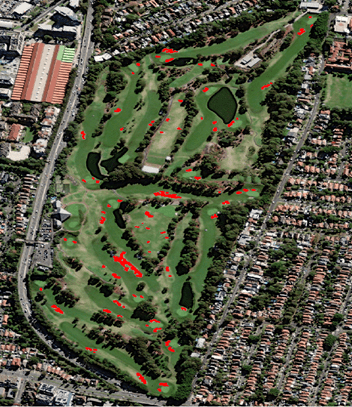
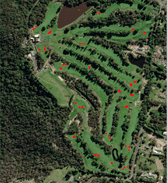
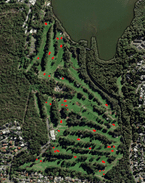
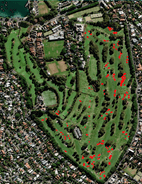
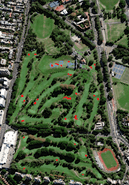
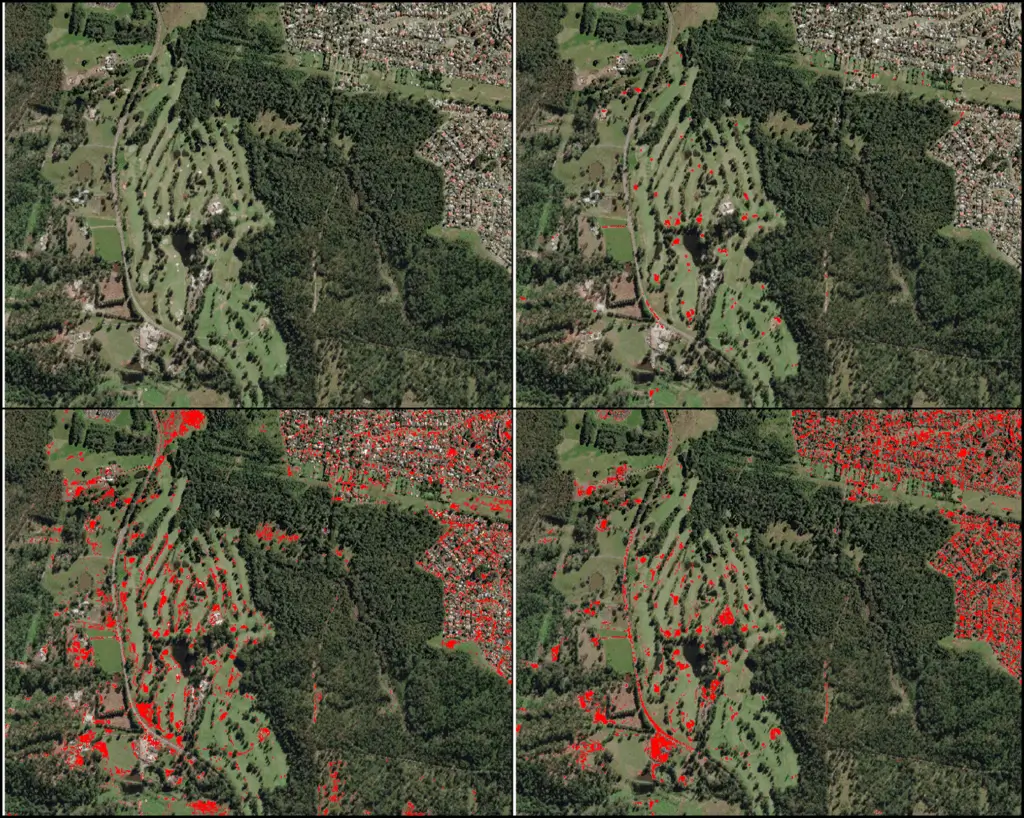
Figure 4: Bunker Labels were drawn for 4 other golf course (a) Monash (b)Cromer (c)The Royal Sydney and (d) Moore Park golf courses.
Once the labelling of training rasters shown (Figures 3 and 4) was complete, the next step was to train the Deep Learning Model. Training involves repeatedly exposing label rasters to a model. Over time, the model will learn to translate the spectral and spatial information in the label rasters into a classification image that maps the features it was shown during training.

Deep Learning is relatively new, and it is considered a more sophisticated form of machine learning that can excel in scenarios like this, where the distinction between the golf bunkers and colours of many roofs and structural features in the scene can be confusing in aerial imagery. ENVI Deep Learning looks for spatial and spectral patterns in image pixels that match the training data it was provided. Specifically, this example uses the pixel segmentation approach to training.

Once the Deep Learning model using labels of bunkers from golf course in Eastern Sydney was trained, the next step for me was to apply this model over a different area altogether. For this new area, I looked west and found three golf courses in the foothills of the Blue Mountains around Penrith. I was very confident that the model would behave well, and I did get encouraging result indeed. Figure 5 shows the example of the model applied over the Heritage Valley Golf course and barring a few false positives, the result is remarkable.
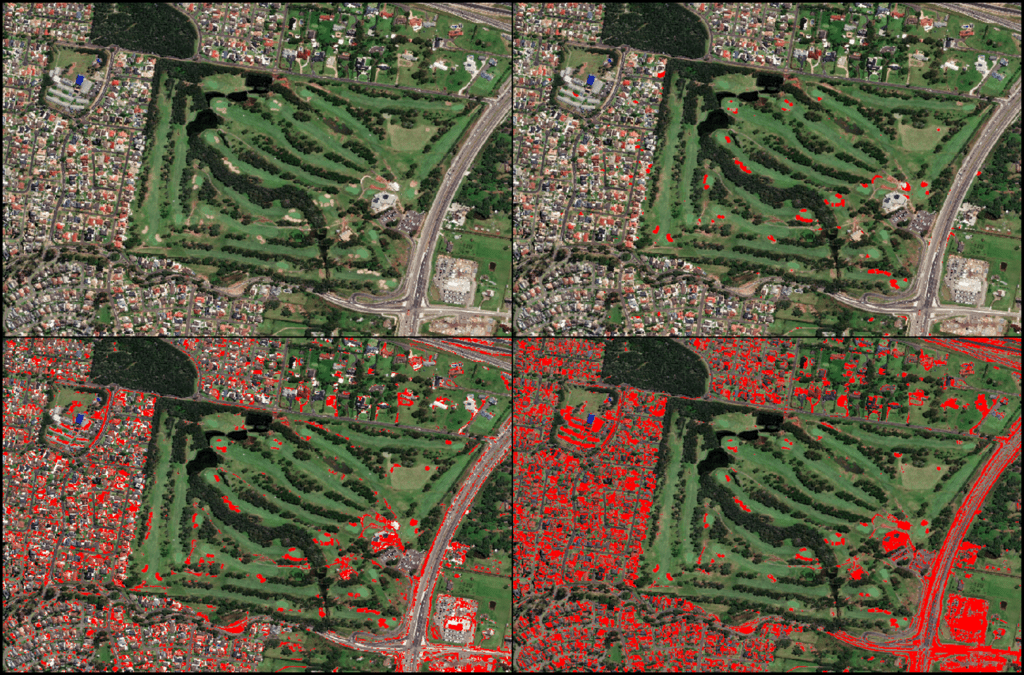
One question I often get asked is, why do you have to go through such a convoluted (yes literally!) process of Deep Learning when you could perhaps get the result by using much simpler methods? This is a very valid question. The real test of the Deep Learning Method is comparing outputs from traditional statistics-based spectral techniques, such as Supervised and Unsupervised methods of classifications. Given that the image used for this exercise is 3-band RGB data, I was even more curious to find out how these traditional techniques would work without having the luxury of an infrared band that would provide easy discrimination of vegetation with materials contained in the bunkers (sand) and surrounding buildings and other man-made features.

The result of comparison using the Glenmore Heritage Valley course is shown in Figure 6. The bunkers obtained by each of the classification methods is shown in red. I used a supervised method of classification using 7 classes and an Unsupervised method of classification splitting the image into 10 classes. It was indeed very interesting to see what other features in the images are confused with bunkers. The outputs (the bunkers are shown in red) indicate that there is significant confusion in extracting the bunkers with traditional classification method. The results show that the bunkers are easily confused with building rooftops and bare soil in surrounding areas. The results obtained using Deep Learning holds remarkably well with only a very few false positives. I would expect this to be the case, given it is a 3-band RGB image and reliance would have to be on colour, shape and sizes of the bunkers and Deep Learning method does a good job of detecting these features.
I wanted to doubly check that my Deep Learning Model was working well on other golf courses to find the bunkers accurately and not picking up unwanted features. I was happy with the result I got when applying the same Deep Leaning model over the Penrith Golf Club (Figure 7).
In conclusion, Deep Learning technology provides a robust solution for learning complex spatial and spectral patterns in data meaning that it can extract features from a complex background, regardless of their shape, colour, size, and other attributes. TensorFlow models are at the core of the overall process and TensorFlow is an open-source library that ENVI uses to perform deep learning tasks. A TensorFlow model is defined by an underlying set of neural network parameters.
ENVI Deep Learning provides two methods for extracting features, depending on your intended use:
	Pixel segmentation: Classify each pixel individually.
	Object detection: Locate groups of pixels that represent particular features.

The Deep Learning Guide Map will guide you through the steps needed to extract features using either of these methods..
*APAC Geospatial is Exclusive distributor of ENVI and ENVI Deep Learning products in Australia.
To find out how APAC Geospatial could help you with your remote sensing software and solution requirements, contact us on 1300 348 668, via email on info@apacgeospatial.com or submit the form here.
Author details:
Dr. Dipak Paudyal
e-mail: dpaudyal@apacgeospatial.com
Chief Scientist & Managing Director
APAC Geospatial
Fellow SSSI
Adjunct Associate Prof, University of QLD
LinkedIn: https://www.linkedin.com/in/dipak-paudyal-b56aa534/
Web: https://apacgeospatial.com/